Help Page and FAQ
Clark County Regional Flood Control District
Content
Gauge Map
The Gauge Map web application displays a map of all gauges accessible from Clark County Regional Flood Control District.
This application is a modern implementation of the previous gagemap application
You can perform different actions using buttons in the navigation bar on the left side of the application. You can expand it for more information using the bottom ">>" button.
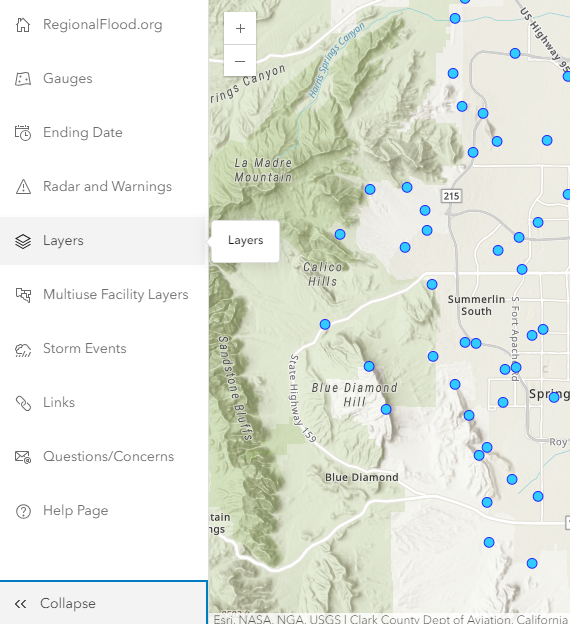
Gauges
Switch between gauges by selecting the corresponding gauge you would like to have displayed. Only one gauge can be selected. If viewing live data (not historical), it will refresh every minute with new data.
- Rainfall
- Current precipitation level. Click the station on the map to view a popup with station summary data. A link to the station data and a picture for the station can also be found in the popup.
- Water Level
- Current water level. Click on the station on the map to view a popup with station summary data; stage-storage information is displayed if applicable. A link to the station data can also be found in the popup.
- Weather
- Displays all weather stations and the information below:
- Air Temperature
- Relative Humidity
- Dewpoint Temperature
- Wind Speed and Direction
- Wind Barbs
- Displays NWS wind barbs and wind speed in MPH.
- Gate
- Displays Winnick Ave. gate information. There are four gates. C = closed, O = opened.
Ending Date
In the Ending Date tab, you may enter an end date/time and the interval. After setting the date/time and interval, the map will update to the corresponding interval.
Radar and Warnings
This tab contains a layer for NWS's base reflectivity radar and weather warning layers.
Layers and Multiuse Facility Layers
This tab contains miscellaneous layers provided by CCRFCD that range from the location of watersheds to traffic cameras. The multiuse facility layers tab highlights any layers included in .
Storm Events
In the Storm Events tab, you may select a specific storm event for analysis. Total storms are typically static images while most other events (base reflectivity, 1hr storm, etc) are timeline events. Timeline events will have a time slider pop up where you will be able to play through the event or scrub through each frame.
You may be able to adjust the playback rate of timeline events using the slider at the top of the Storm Events tab. Adjusting the playback rate while a storm event is playing will pause the event.
Gauge Info
The Gauge Info web application displays detailed information like repeating interval data about individual stations. Using this data, the application also generates a chart for data visualization.
Home (gaugeinfo/)
Displays a list of gauges accessible from Clark County Regional Flood Control District. You may be able to display all available gauges or filter the type of gauge shown (rainfall, weather, etc.).Station Data (gaugeinfo/station/[id])
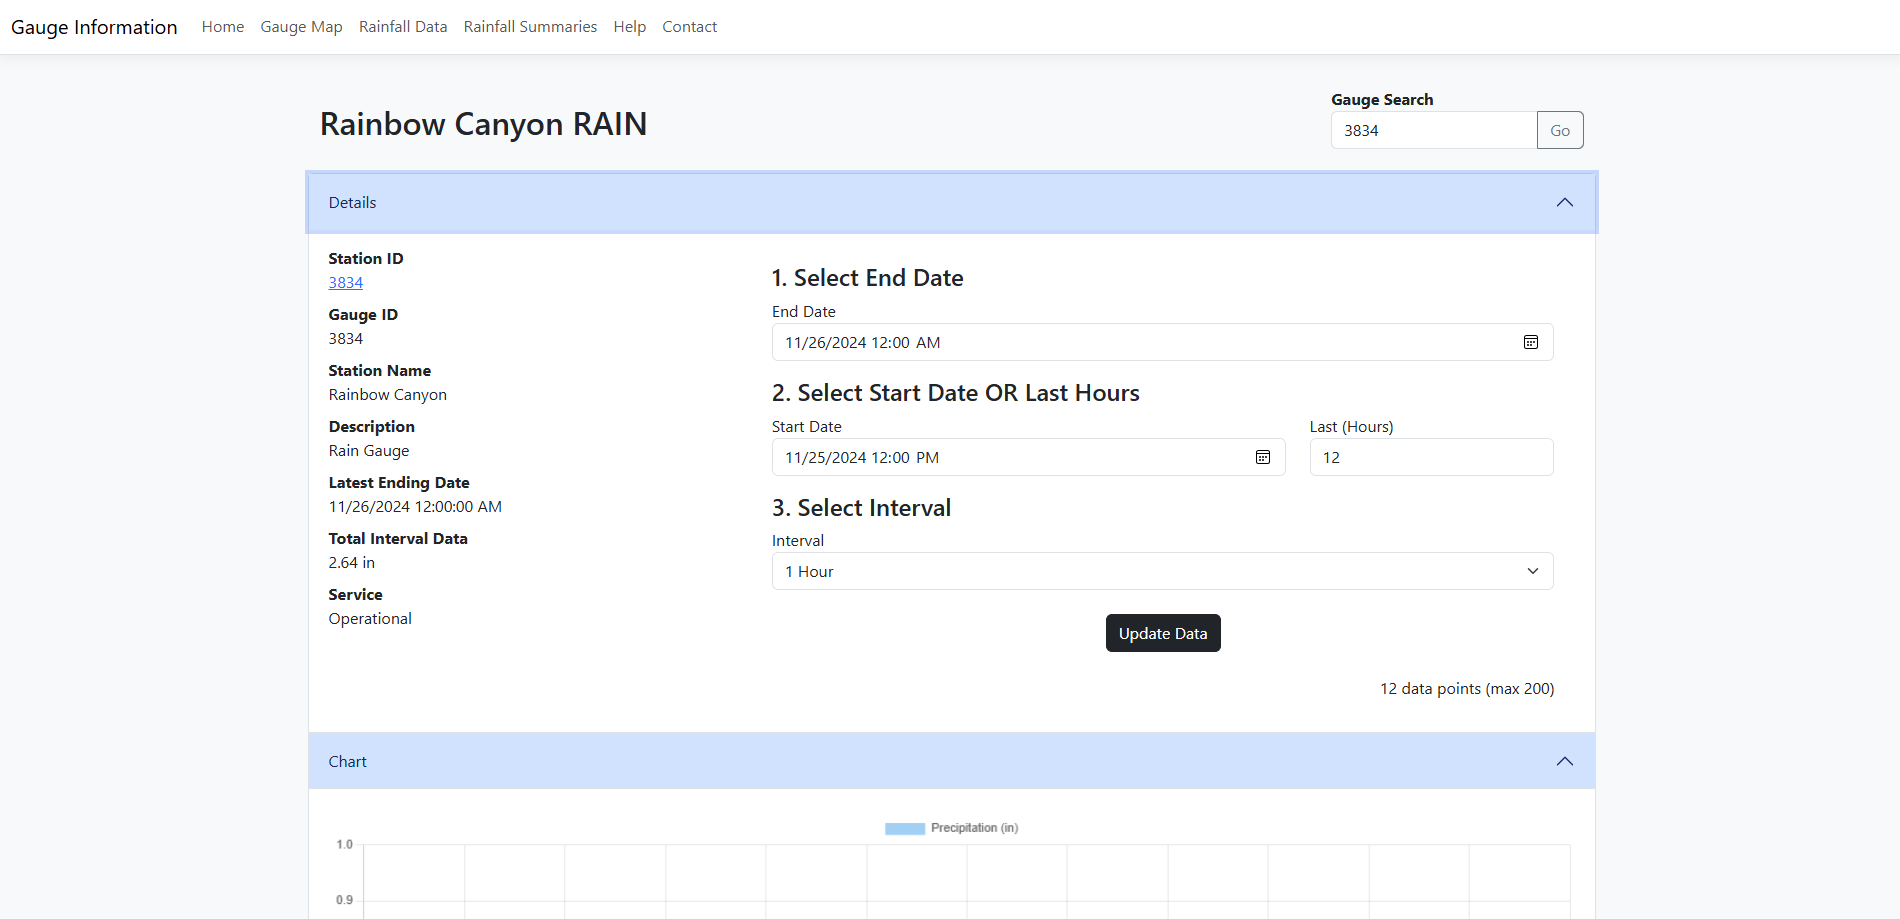
Station data is dependent on the gauge ID provided in the link. You may be able to manipulate the start date, end date, and interval to obtain historical data.
- Gauge Search
- At the top right, there is a "Gauge Search" input field where users can enter a gauge ID and click "Go" to load data for a different gauge.
- Details
- This section provides information about the selected gauge and allows users to customize the data display
- Chart
- This section displays a graphical representation of the rainfall data. The y-axis represents the unit of measurement dependent on the gauge type. The x-axis represents time. The chart type is dependent on the gauge type (e.g., rainfall, temperature, etc.), and in this case, for rainfall, it is a bar chart showing precipitation over time.
- Data
- This section presents the data in a tabular format. It lists the "Date" and "Time" of each data point, along with the corresponding "Data". A "Download CSV" button is available, allowing users to export the data for further analysis.
Design Rainfall Data (gaugeinfo/Rainfall/Data)
This page displays "Design Rainfall Data for Las Vegas Valley Area," presenting typical rainfall or precipitation data and their recurrence intervals. The data is organized in a table format with "TIME" as the rows and "RECURRENCE INTERVAL" as the columns.
The "TIME" column indicates various durations of rainfall, ranging from 5 minutes to 24 hours. The "RECURRENCE INTERVAL" columns, labeled as 2-YR, 5-YR, 10-YR, 25-YR, 50-YR, and 100-YR, represent how frequently a rainfall event of a given magnitude is expected to occur. For example, a "10-YR" recurrence interval means that a rainfall event of that intensity or greater is expected to occur, on average, once every 10 years.
Station Summaries (gaugeinfo/Historical)
This page displays monthly precipitation data for each rain gauge. The current year is updated the beginning of each month.
Precipitation data can be downloaded as a CSV for any year prior to the current year.